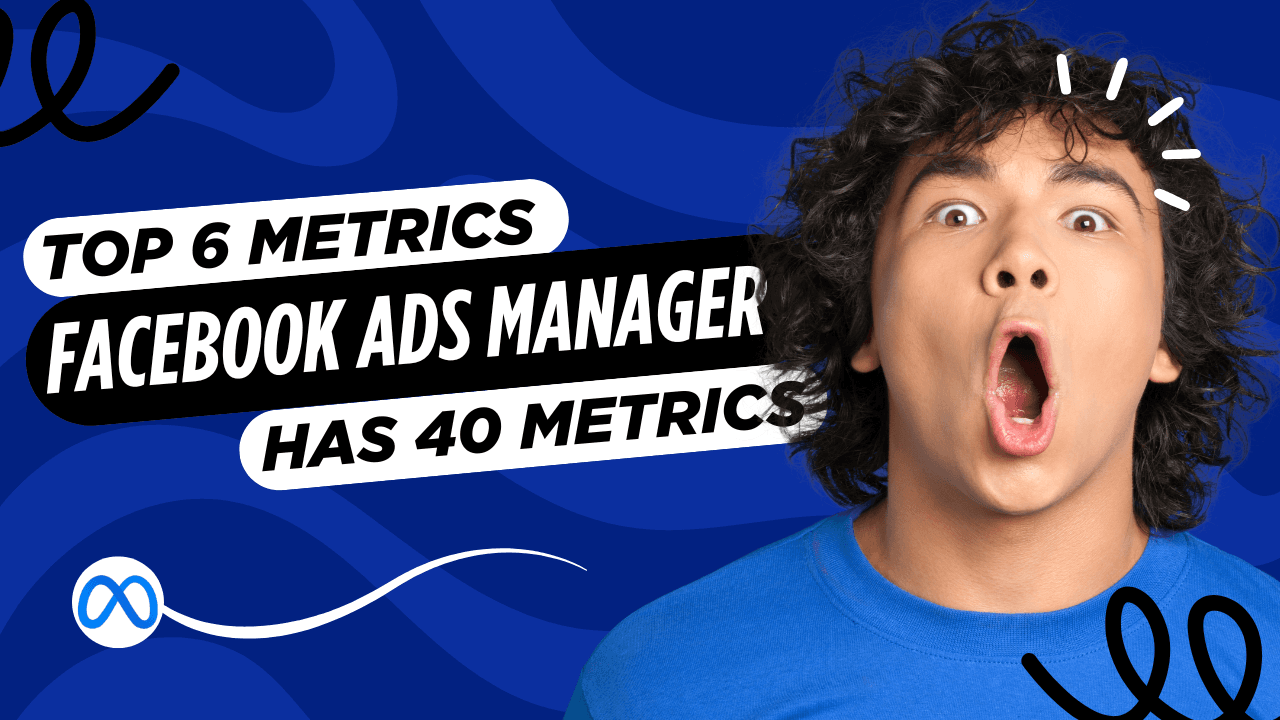
Open the columns menu in Ads Manager and you'll find dozens of options, reach, frequency, CPM, CPC, CTR (link and outbound, which are different), CPA, ROAS, cost per add-to-cart, cost per initiate checkout, quality ranking, engagement rate, and on and on. Almost none of it is useless exactly, but almost all of it is more than anyone needs to look at regularly, and the sheer volume is a real reason people either check obsessively or stop checking altogether.
Neither extreme works well. The metrics that actually tell you whether an account is healthy are a small handful, and, this is the part that gets missed, they mostly matter in combination with each other, not as single numbers you glance at in isolation.
The 6 Metrics Worth Regular Attention
1. ROAS (return on ad spend), tracked as a trend, not a single number. A single day's ROAS is noisy and not very meaningful. A multi-day trend, is it climbing, flat, or declining, tells you far more than today's figure alone. And remember ROAS measures revenue against spend, not profit; it's a directional signal, not a profitability calculation on its own.
2. CPA (cost per acquisition), against your own breakeven, not a generic benchmark. There's no universal "good" CPA, it depends entirely on your margins and average order value. Know your own breakeven CPA once, and track actual CPA against that specific number.
3. Frequency. How many times, on average, the same person has seen your ad within a given window. Rising frequency isn't automatically bad, but it's the first number that tells you when to start watching creative performance more closely.
4. CTR (click-through rate), read alongside frequency. A falling CTR on its own could mean many things. A falling CTR while frequency is climbing is a specific, meaningful signal, the audience is tiring of the creative.
5. CPM (cost per thousand impressions), used as a control. If CPM is climbing at the same time CTR is falling, that points to a broader market or auction shift rather than creative fatigue specifically. If CPM stays flat while CTR falls and frequency climbs, that's a much cleaner signal that the creative itself is the issue.
6. Spend pacing against budget. Simple, easy to overlook: is the account actually spending what it's allocated, or is a chunk of budget sitting unused because an ad set can't find enough qualified auction opportunities? Under-delivery is a structural problem, not a performance one, and it's invisible unless you specifically check for it.
Why Reading Them Together Matters More Than Any Single Number
This is the part a long column list in Ads Manager doesn't communicate on its own: these metrics are far more informative in combination than individually.
Rising frequency alone: not necessarily a problem, could just mean a smaller, well-targeted audience. Rising frequency plus falling CTR plus flat CPM: that specific combination is the signature of creative fatigue, and it's a much more confident diagnosis than any one of the three metrics would give you alone.
Falling ROAS alone: could be creative fatigue, could be audience saturation, could be a tracking issue, could be a genuine market shift. Falling ROAS plus rising CPA against your specific breakeven plus stable frequency and CTR: points away from creative and audience issues, toward something else, potentially a cost-structure change on your end, or a broken tracking setup.
This is why staring at a single metric in isolation, even an important one like ROAS, tends to produce more anxiety than insight. The metric alone doesn't tell you what to do about it. The combination usually does.
A Practical Way to Use This
Rather than reviewing all 40+ available columns, build a simple weekly view with just these six, and get used to reading them as a set rather than scanning down a long column list looking for anything that looks off. Over a few weeks, you'll develop a feel for what "normal" looks like for your specific account, which makes it much easier to spot when something's actually changed, rather than reacting to routine day-to-day noise.
Where This Still Takes Judgment (And Where It Doesn't Have To)
Reading these six metrics together and correctly diagnosing what they're telling you is a real skill, and it's one most people build slowly, through trial and error, often after misdiagnosing a few things along the way. That's a reasonable cost for someone who wants to genuinely understand their account deeply.
For a faster path to the same conclusion, this is exactly the kind of pattern-matching a deterministic rules engine is well suited to, checking the same combinations described above, automatically, and telling you directly "this looks like creative fatigue" or "this looks like a tracking issue" rather than leaving you to notice the pattern yourself across six separate columns. That's the core of what WizeScale's Score and signals are built to do: turn the same six-metric reading process described here into a direct answer, continuously, instead of a weekly manual review.
Six Numbers, Read Together
You don't need all 40 columns Ads Manager offers. You need six, read as a set rather than individually, and a rough sense of what combination of movements points to what underlying cause. Build that habit and most of the anxiety of "too many metrics, no idea what to look at" goes away, because you're not looking at forty things anymore, you're looking at six, in a pattern you recognize.
See your account's health Score with WizeScale to get these six read for you automatically, with a direct answer instead of a pattern to interpret. Read-only, ready in minutes.